


In 2014, there were 29.6 million small businesses.*
The number of small employers has increased after a decline during the recession. The number of nonemployers has gradually increased, from 15.4 million in 1997 to 23.8 million in 2014.

Source: SUSB, NES
Small businesses comprise:
Source: SUSB, NES (2014), ITA (2015)
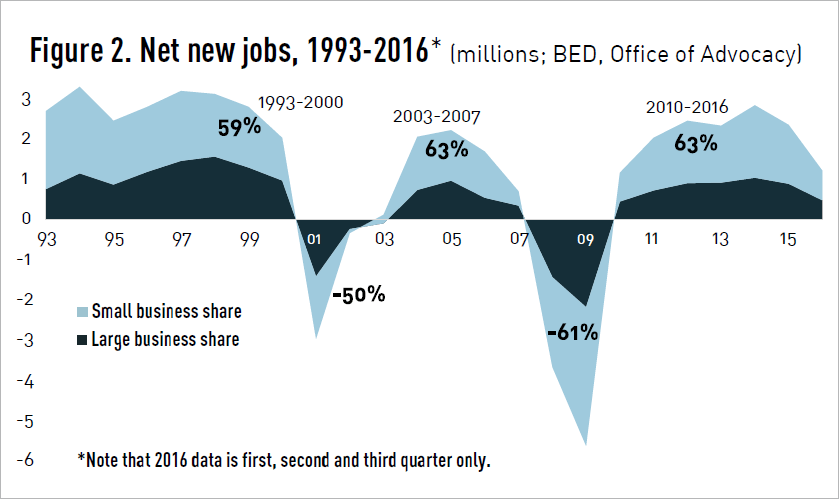
Small businesses accounted for 61.8% of net new jobs from the first quarter of 1993 until the third quarter of 2016. Figure 2 shows details from 1993 to 2016. The small business share of net job change was strongly positive for most of this 24-year time span, except during two recessionary periods.
* The number of small businesses reflects data collected in 2014 and released in 2016. In general, the data contained in Frequently Asked Questions About Small Business are the most recent statistics available from government sources.
Source: BED
As firms grow, they change employment size classes. So as small firms grow, their growth counts toward small firm job gains; but if they pass the 500-employee mark, their employment is classified as large firm employment.
79.9% of establishments started in 2015 survived until 2016, the highest share since 2006. From 2005 to 2015, an average of 78.5% of new establishments survived one year.
Although data is not available on firm survival rates, other data sources suggest that about two out of three establishment exits are the result of firm closures.
Source: BED, BDS; Office of Advocacy calculations
In 2014, there were about 404,000 startups (firms less than one year old) and 392,000 firm closures (Table 1). The share of businesses that were startups has hovered around 8% since 2010 (Figure 3).
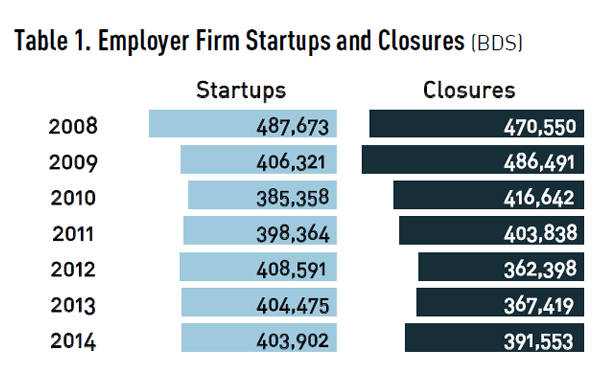
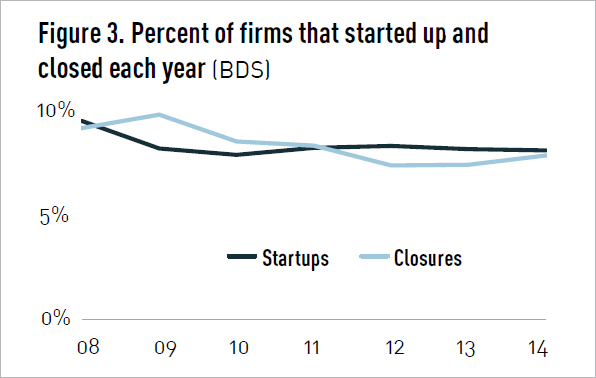
Source: BDS
In 2012, there were 9.9 million women-owned firms, and 2.5 million firms owned equally by men and women (Table 2). This means that 12.3 million firms, or 45% of all classifiable firms, were at least 50% women-owned.

Source: SBO, “Women’s Business Ownership: Data from the 2012 Survey of Business Owners,” 2017. www.sba.gov/sites/default/files/advocacy/Womens-Business-Ownership-in-the-US.pdf
In 2012, 8 million businesses were minority-owned, or 29.3% of U.S. firms. Of these, 12% were Hispanic-owned, 10% were Black- or African American-owned, 7% were Asian-owned, 1% were owned by American Indians and Alaska Natives, and 0.2% were owned by Native Hawaiians and other Pacific Islanders (Table 2).
Source: SBO
In 2012, veterans owned 2.5 million businesses, or 9.3% of U.S. firms. About one-fifth of these firms, or 440,000, had paid employees (Table 2).
Source: SBO, “Veteran-Owned Businesses and Their Owners,” 2017. www.sba.gov/advocacy/veteran-owned-businesses-and-their-owners.
About one-seventh, or 14.4%, of business owners are immigrants. The industries with the greatest share of immigrant owners were accommodation and food services (29.1% of owners were foreign-born), and transportation and warehousing (27.5%).
Source: SBO
Advocacy research shows that in 2014, millennials were less likely to be self-employed than older individuals. This research also shows that the rate of self-employment among individuals age 15 to 34 has been gradually declining since 1990.
Source: “The Missing Millennial Entrepreneurs,” February 2016. www.sba.gov/sites/default/files/advocacy/Millenial_IB.pdf
About one in five firms (19.3%) are family-owned. Of these family-owned firms, about half are “equally-owned,” that is, 50% owned by one or more men, and 50% owned by one or more women. Hence, about one in 10 firms is both family-owned and equally-owned.
The industries with the highest share of family-owned firms are management of companies and enterprises (46.4% of firms in this industry are family-owned), real estate and rental and leasing (37.3%), and accommodation and food services (33.2%).
The industries with the highest share of equally-owned firms are real estate and rental and leasing (18.6% of firms in this industry are equally-owned), mining, quarrying, and oil and gas extraction (16.9%), and accommodation and food services (16.9%).
Source: SBO
A home-based business is operated primarily out of one’s home, but business activities may take place at other locations as well. The share of businesses that are home-based has remained relatively constant over the past decade, at about 50% of all firms. More specifically, 60.1% of all firms without paid employees are home-based, as are 23.3% of small employer firms and 0.3% of large employer firms. The industries in which businesses are most likely to be home-based are information (70.0%), construction (68.2%), and professional, scientific, and technical services (65.3%).
Source: SBO
Overall, 2.9% of firms are franchises. More specifically, 2.3% of nonemployer firms are franchises, as is 5.3% of small employers and 9.6% of large employers.
Source: SBO
The size of startups has fluctuated over the past decade, but in 2014 average employment reached a four-year high of 6.1 employees. Average employment at firms of all ages has increased slightly during this period, from 22.4 employees per firm in 2005 to 23.5 employees per firm in 2014 (Figure 4).

Source: BDS
In 2014, there were 248,122 small employer firms in high-tech industries, representing 98.5% of all employer firms in these industries. The majority of these small firms provide services in either computer systems design or architecture and engineering (Figure 5). Among small firms, the industries with the highest growth from 2012 to 2014 were software publishers and computer systems design services (Table 4).
Note: This publication uses the Level I high-tech industries listed in Hecker’s 2005 analysis, with the exception of 5161 and 5181, as no corresponding NAICS codes were available for 2012 or 2014 data. For the definition of high-tech industries, see www.bls.gov/opub/mlr/2005/07/art6full.pdf.
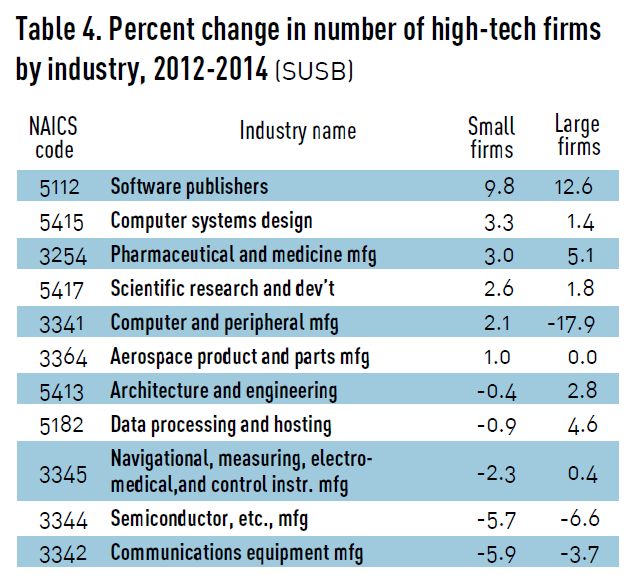

Source: SUSB, NES (2014), ITA (2015)
Small businesses represent about 95.9% of employer firms in high-patenting manufacturing industries, a percentage that remained constant from 2012 to 2014. During the same time period, small businesses’ share of employment, payroll, and receipts decreased slightly (Table 5).
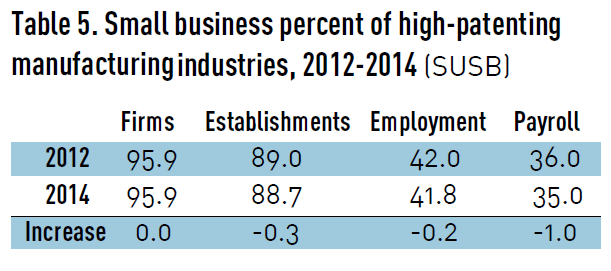
Source: SUSB